Media Optimizer reports
Last updated: Oct-18-2023
Cloudinary's Media Optimizer reports give you the ability to keep track of how your media is being delivered, how your assets are performing, how quality is impacted by media optimization, and any errors encountered.
In the Reports tab of the Media Optimizer console, you can see the different categories of reports:
Delivery reports
The delivery reports provide metrics on all aspects of media delivery, from bandwidth to browsers, over a selected time period. Each report has different filtering and display capabilities so, for example, you can see the difference between images and videos, and present information based on bandwidth or requests. The charts let you export the data to CSV, PDF or SVG.
Here's a complete list of delivery reports:
| Report | Description |
|---|---|
| Transformations | The number of transformations over the selected period. |
| Bandwidth | The amount of bandwidth used delivering media assets. |
| Requests | The number of requests for media assets. |
| Top Assets | The most requested assets, or those contributing to the highest usage of bandwidth. |
| Top Transformations | The most requested transformations, or those contributing to the highest bandwidth usage. |
| Top Delivered Assets | The most requested delivered assets, or those contributing to the highest bandwidth usage. Different derived versions of the same asset are counted separately. |
| Top Referral Domains | The domains from which the most referrals have been made, or those contributing to the highest bandwidth usage. |
| Top Referral Pages | The pages from which the most referrals have been made, or those contributing to the highest bandwidth usage. |
| Resource Types | The breakdown of how each type of asset contributes to the overall bandwidth usage or number of requests. |
| Top Formats | The most requested formats, or those contributing to the highest bandwidth usage. |
| Top Browsers | The most used browsers in terms of requests made or bandwidth usage. |
| Top Countries | The countries making the most requests or using the most bandwidth. |
Performance reports
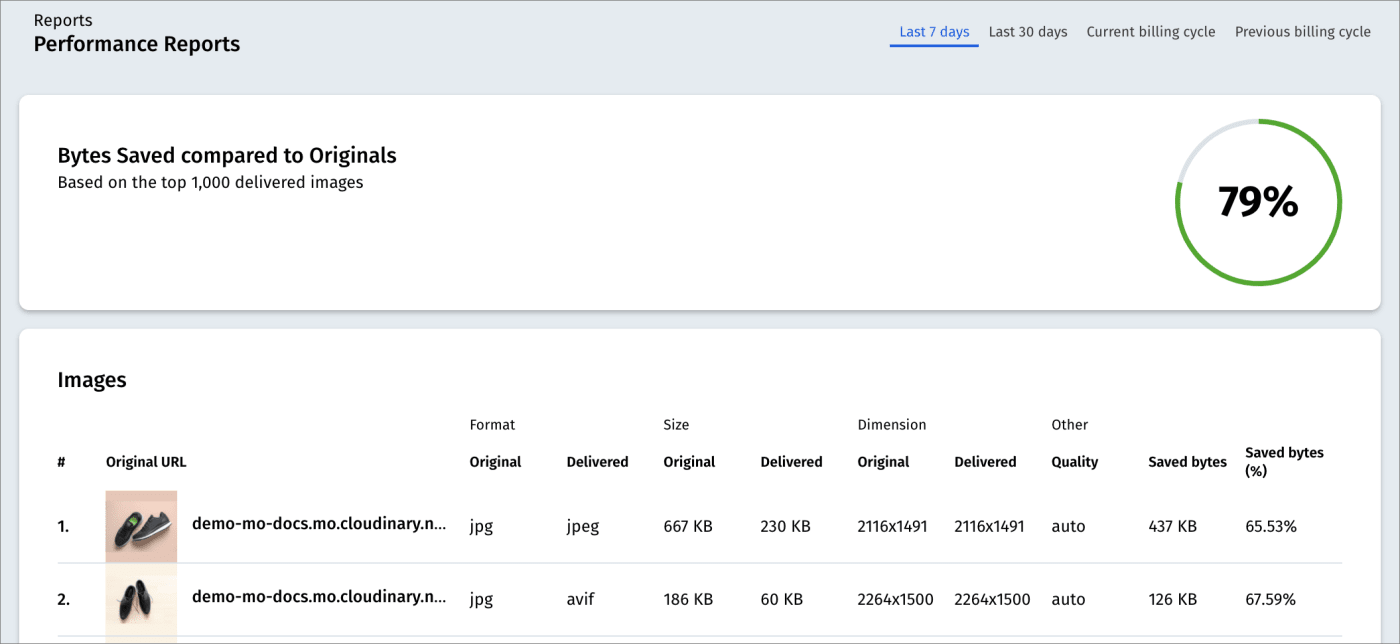
The performance reports show how many bytes have been saved over a selected time period by using Media Optimizer, based on the 1000 most requested assets.
For each asset you can see:
- The original and delivered format
- The original and delivered size
- The original and delivered dimensions
- The type of quality used
- The number of bytes saved
- The percentage saving on bytes
Quality reports
The quality reports are currently relevant only to images, and give you an idea of the quality of both your delivered and original images. Two scores are presented, both of which represent an average of the 1000 most requested derived images:
- Fidelity score: Indicates how closely the delivered image represents the original source from which it was generated.
- Pixel score: Provides a measure of how the original image looks in terms of compression artifacts (blockiness, ringing etc.) and in terms of capture quality (focus and sensor noise). Downscaling can improve the perceived visual quality of an image with a poor pixel score.
The scores for the individual assets are also displayed.
Error reports
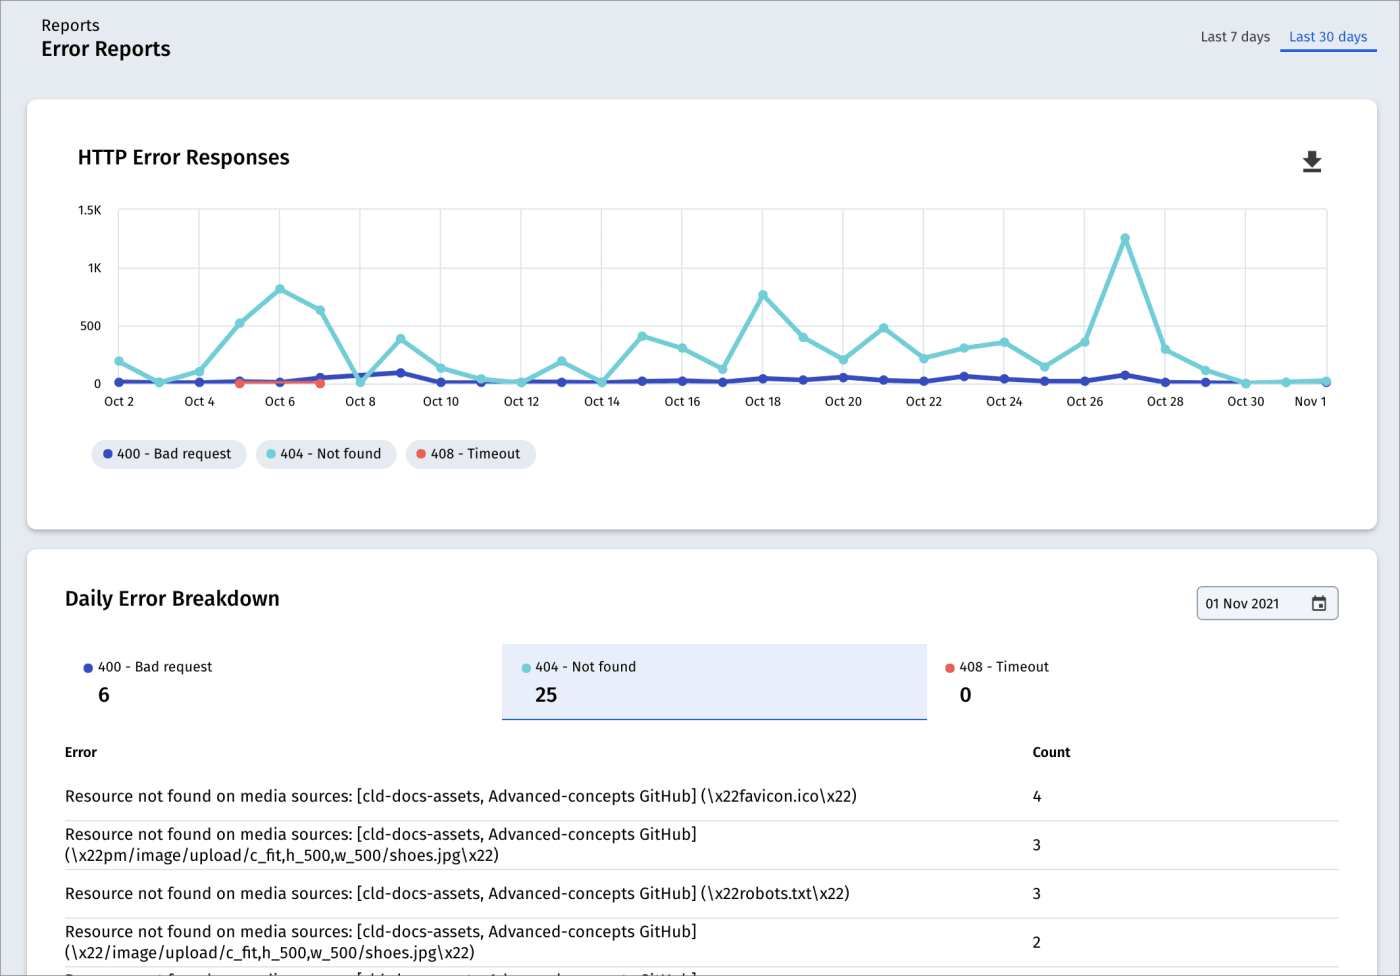
The error reports include a chart of errors encountered when requesting assets or making API calls to your account. Errors are shown over a selected time period and broken down by HTTP error code. By selecting a specific error code, you can see a breakdown of those errors for a specific day.
 Programmable Media
 Digital Asset Management


