Build a flow
Last updated: Feb-12-2024
Flows consist of a set of functional blocks that you connect together, enabling you to create step-by-step actions for execution. Each block performs a specific function. By combining different blocks, you can develop a customized application to address your media use case effectively.
Blocks are grouped into different categories such as Triggers, Flow Logic, and Developer Tools, to make them more accessible. For more in-depth information on each block, refer to the Block reference.
The canvas
The canvas is your visual development environment. It allows you to view, edit, test, debug, and deploy your application.
The canvas has three available sidebars: Flow Description, Add Blocks, and Logs.
All sidebars are accessible via the buttons in the Navigation Bar on the left.
Adding blocks
To add blocks:
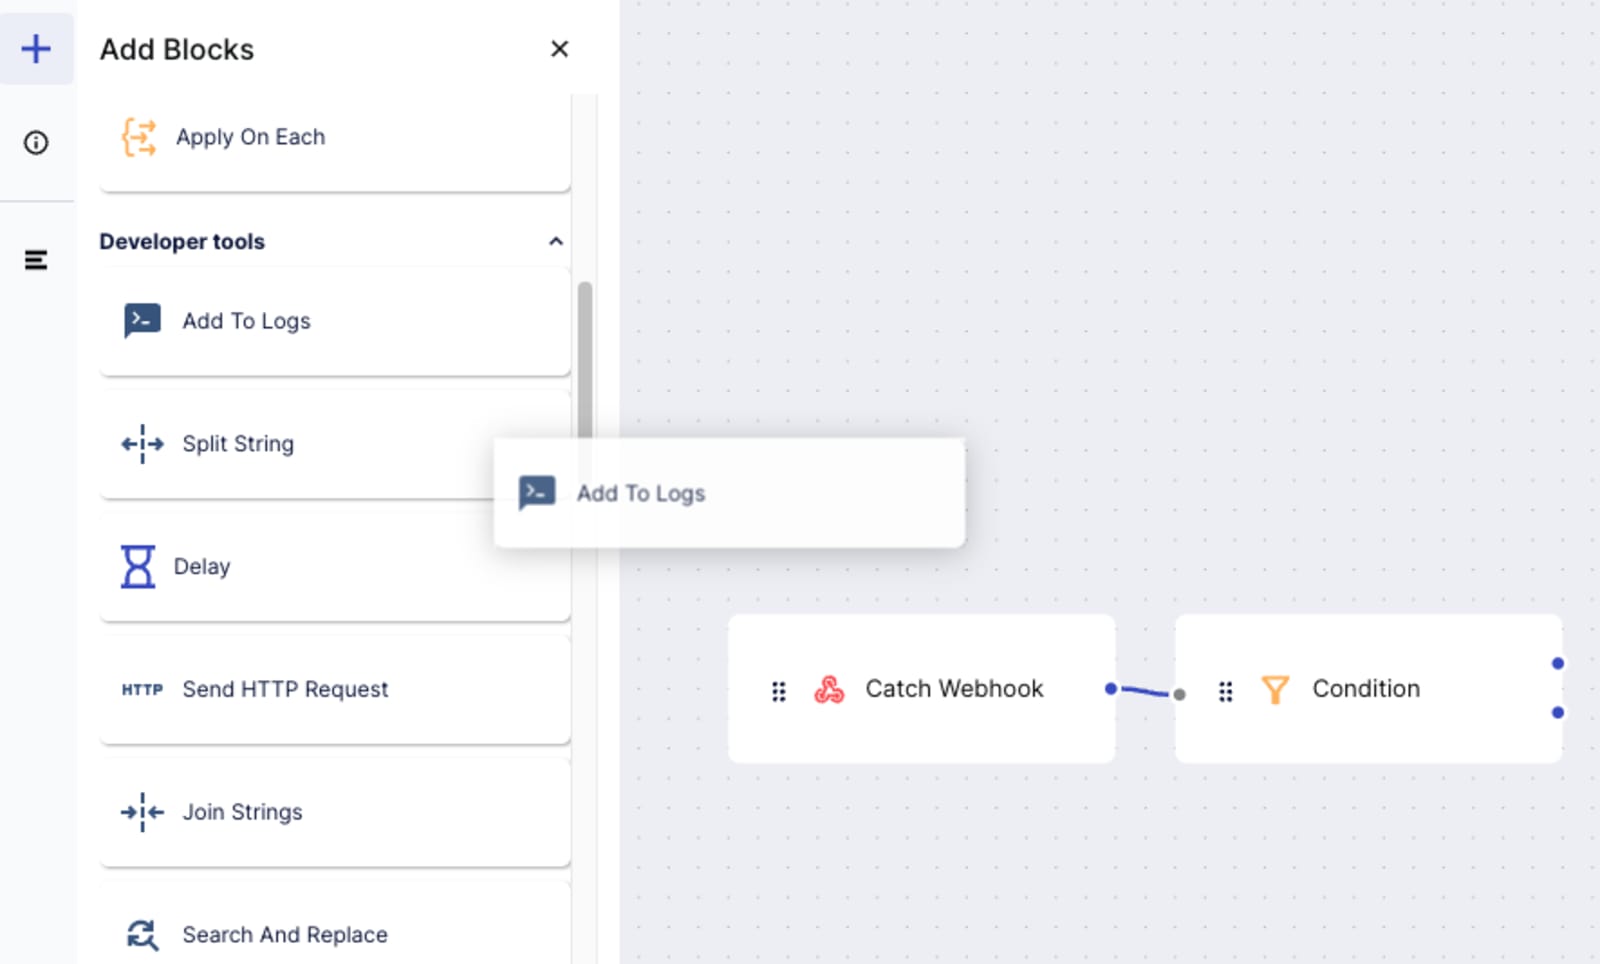
- From the Navigation bar on the left, click the + to open the Add Blocks sidebar.
- From the Add Blocks sidebar, select the block you want to use and drag it to the canvas.
Connecting blocks
Drag the blue dots to connect a block to the next block in the flow.
In the example below, the Rename Media block will be executed after the Manual Moderation block.
A block can be connected to multiple blocks. In the example below, once the Manual Moderation block executes successfully, both the Rename Media and Send Email Using SendGrid blocks are executed in parallel.
Configuring a block
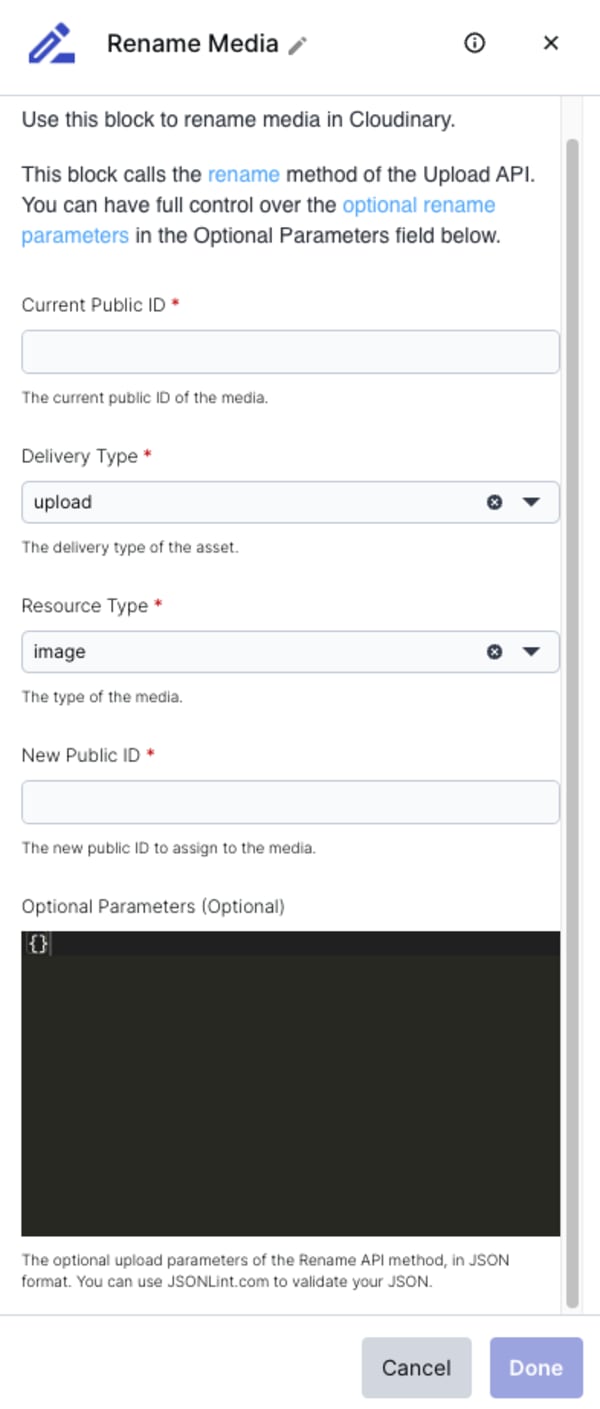
Click on a block's name to open its configuration sidebar where you can configure all the input fields for this block instance.
Using dynamic values
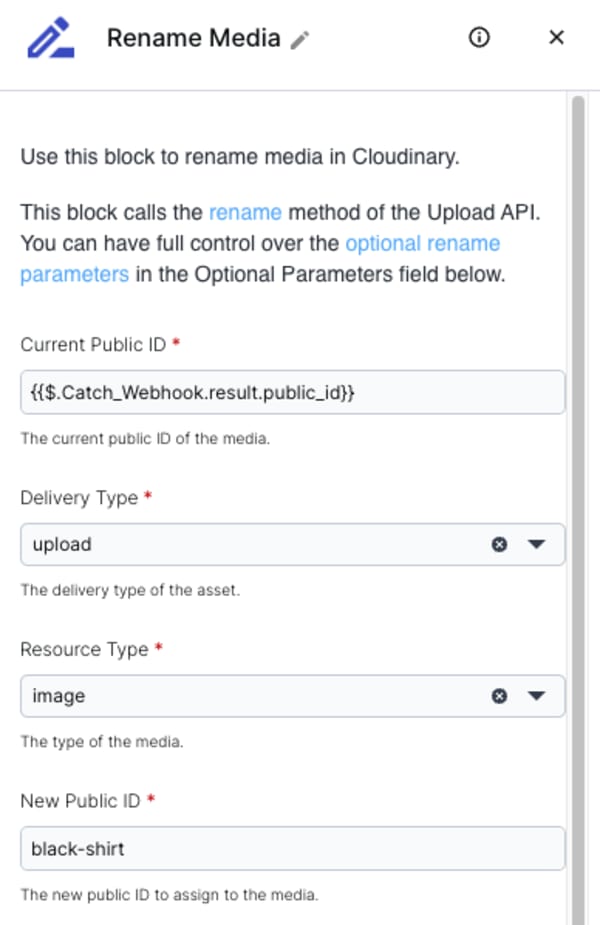
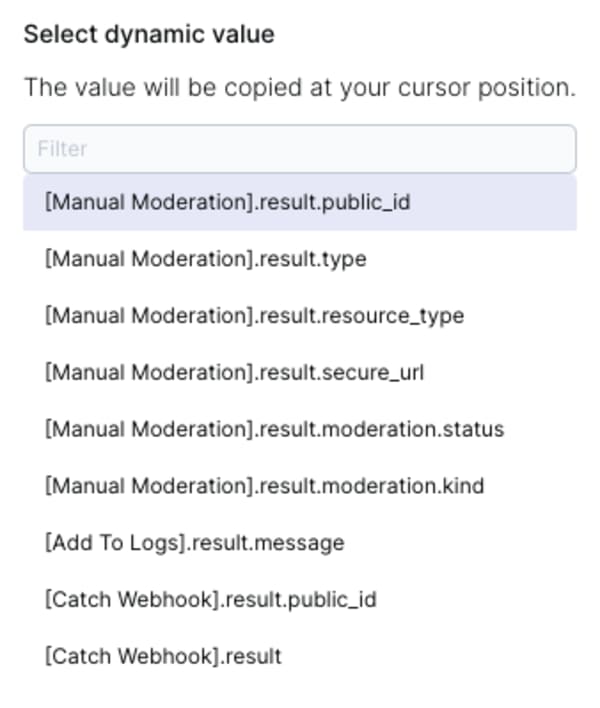
A block's input field can be set using a hard-coded value or a response value from a previous block in the flow. In the example below, the New Public ID field is hard coded while the Current Public ID is dynamically calculated from the response of a Catch Webhook trigger block.
To set an input field with a dynamic value:
- Click the
{}button above an input field to view a list of suggested dynamic values for that field. - Select the value you want to use and it will be inserted in the input field.
Running a flow
Flows can be triggered programmatically based on their trigger block. Additionally, you can manually trigger these flows directly from within the canvas. This is extremely helpful while building or debugging a flow.
To manually trigger the flow, click the Run button above the canvas.
You can also select the type of action to trigger by clicking on the cogwheel in the Run button, and then selecting the Action profile to execute. For example, if you use a DAM App trigger, you probably want use the DAM App Action profile to trigger the flow. Each of the available Action profiles can also be individually customized to your flow.
Logs
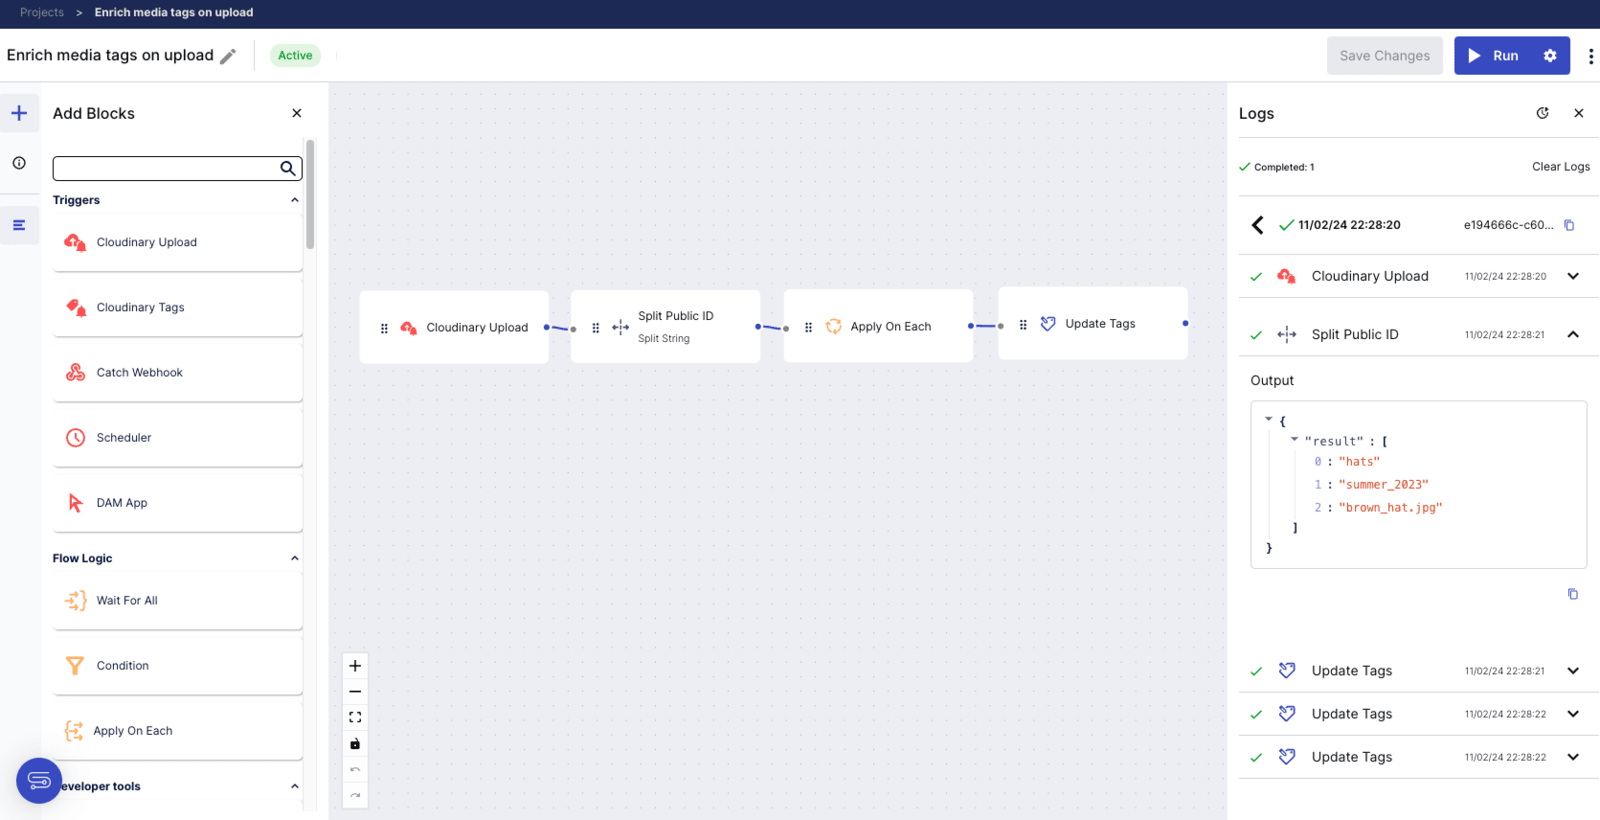
Once a flow is executed, you can view the logs of the execution in the Logs sidebar:
- From the Navigation bar on the left, open the Logs sidebar. All executions will appear in the sidebar, including their execution time and status.
- Click an execution to see the blocks that were executed.
- Click any block to see the output of the block in that execution.
You can also review all past executions by clicking on the History logs icon at the top of the Logs sidebar.
 Programmable Media
 Digital Asset Management

